[Tutorial] Clasificación sinóptica de eventos de precipitación abundante con la librería {synoptReg}
XII Congreso de la AEC. 19 al 21 de Octubre 2022. Santiago de Compostela
Introducción
Este pequeño tutorial tiene como objetivo computar una clasificación sinóptica de los días con precipitación torrencial en el Observatorio del Ebro (Tortosa, Catalunya) con la librería de programación R {synoptReg} lemus-canovas2019]. Los pasos que se seguirán son básicamente 3:
Descarga y cómputo de los eventos torrenciales
Descarga y preproceso de los datos diarios de presión en superfície del reanálisis NCEP/NCAR 2.
Descarga y preproceso de los datos climáticos
library(synoptReg)
library(tidyverse)
library(lubridate)
library(rnaturalearth)
library(metR)

eventos_torrenciales <- read_csv(file = "data/RR_STAID000236.txt",
                      skip = 18) %>%
  mutate(DATE = ymd(DATE),
         RR = ifelse(RR == -9999, NA,RR/10)) %>%
  filter(RR >= 50, DATE >= "1948-01-01")

dates <- eventos_torrenciales %>%
  select(DATE) %>%
  mutate(yr = year(DATE),
         mo = month(DATE))
Ahora que ya hemos filtrado los días con precipitación >= 50 mm/24h, podemos proceder a extraer las fechas de tales eventos para empezar la descarga de los datos del reanálisis NCEP/NCAR.Usaremos los años en que se producen los eventos para no descargar toda la base de datos entera y ahorrar espacio en el disco y tiempo de descarga.
slp_l <- list()
for (ii in 1:nrow(dates)) {
yr <- pull(dates, yr)[ii]
mo <- pull(dates, mo)[ii]

slp_l[[ii]] <- download_ncep(var = "slp",
                     level = "surface",
                     year_range = c(yr,yr),
                     month_range = c(1,12),
                     lat_range = c(25,70),
                     lon_range = c(-20,30),
                     dailymean = T,
                     save_download = F,
                     reanalysis2 = F)

print(paste(ii/nrow(dates)*100, "%"))
}

slp_data <- bind_rows(slp_l)
write_csv(slp_data,"data/slp_dat_1949to2022.csv",col_names = T)
Add a new chunk by clicking the Insert Chunk button on the toolbar or by pressing Ctrl+Alt+I.
slp_data <- read_csv("data/slp_dat_1949to2022.csv") %>%
  distinct(time,lon,lat, .keep_all = T)
vars_torrential <- tidy_nc(x = slp_data,
                       time_subset = dates$DATE,
                       name_vars = "mslp")
vars_torrential
## # A tibble: 45,885 × 6
## var lon lat time value anom_value
## <chr> <dbl> <dbl> <date> <dbl> <dbl>
## 1 mslp -20 70 1949-05-15 102538. 903.
## 2 mslp -17.5 70 1949-05-15 102530 922.
## 3 mslp -15 70 1949-05-15 102482. 907.
## 4 mslp -12.5 70 1949-05-15 102405 866.
## 5 mslp -10 70 1949-05-15 102302. 801.
## 6 mslp -7.5 70 1949-05-15 102182. 711.
## 7 mslp -5 70 1949-05-15 102065 614.
## 8 mslp -2.5 70 1949-05-15 101942. 510.
## 9 mslp 0 70 1949-05-15 101828. 417.
## 10 mslp 2.5 70 1949-05-15 101738. 352.
## # … with 45,875 more rows
## # ℹ Use `print(n = ...)` to see more rowsClasificación sinóptica mediante Análisis de Componentes Principales
When you save the notebook, an HTML file containing the code and output will be saved alongside it (click the Preview button or press Ctrl+Shift+K to preview the HTML file).
info <- pca_decision(vars_torrential,ncomp = 20,norm = T,matrix_mode = "T-mode")The preview shows you a rendered HTML copy of the contents of the editor. Consequently, unlike Knit, Preview does not run any R code chunks. Instead, the output of the chunk when it was last run in the editor is displayed.
info$screeplot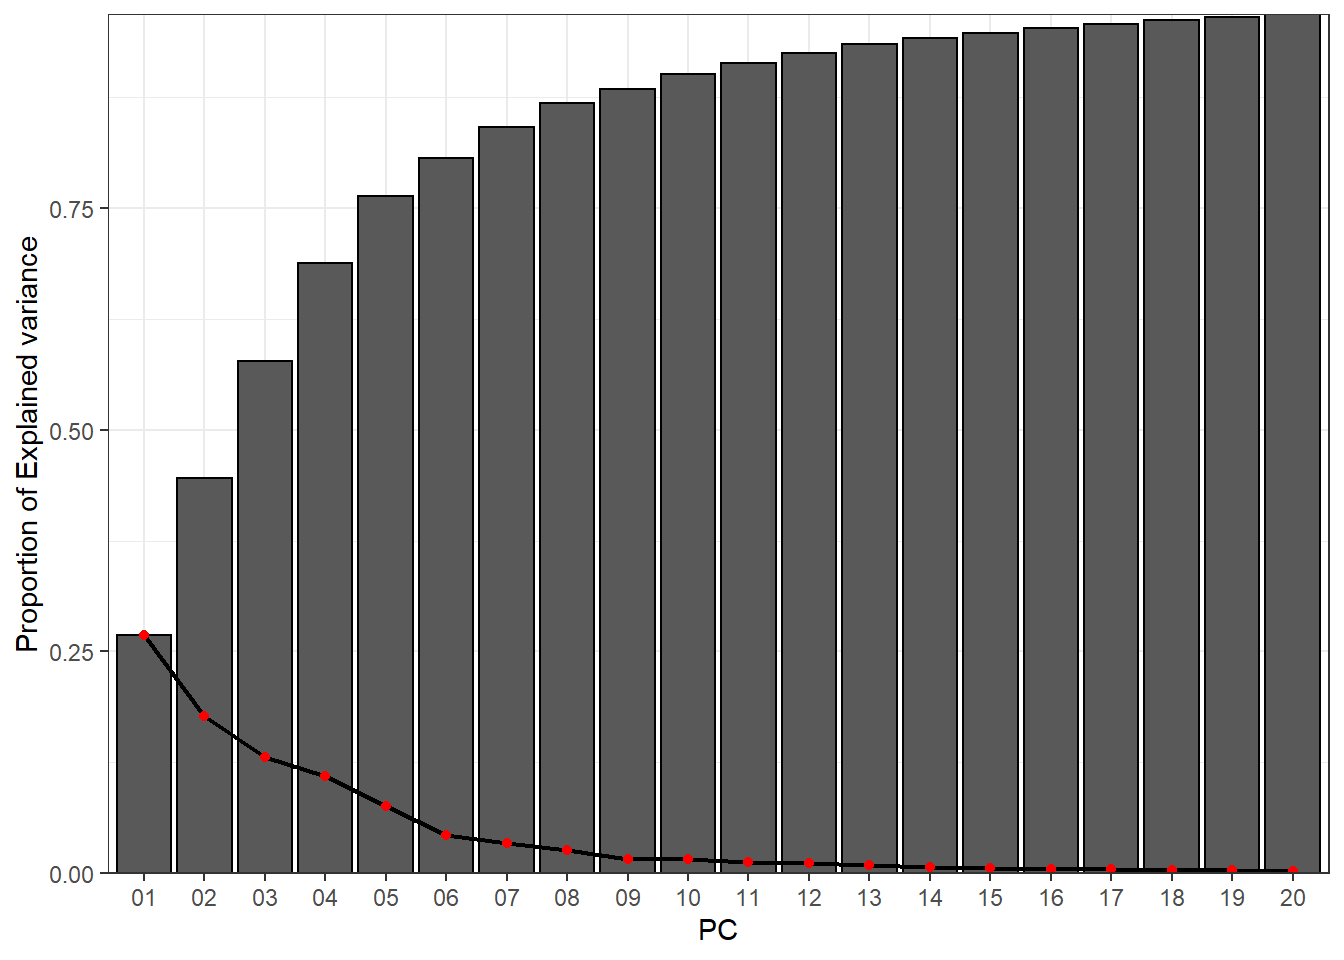
cl <- synoptclas(vars_torrential,ncomp = 6,norm = T,matrix_mode = "T-mode")sf::sf_use_s2(F)
borders <- ne_countries(continent = c("europe","africa"),
returnclass = "sp",scale = 50)
ggplot()+
geom_contour_fill(filter(cl$grid_clas_pn, var == "mslp"),
mapping = aes(lon,lat,z = mean_WT_value/100),
breaks = seq(976,1032,2))+
geom_path(data = borders,aes(long,lat, group = group),
fill = "transparent", color = "black")+
geom_contour2(data = filter(cl$grid_clas_pn,var == "mslp"),
aes(x=lon,y=lat,z=mean_WT_value/100),
binwidth = 2, color = "black") +
geom_text_contour(data= filter(cl$grid_clas_pn, var == "mslp"),
aes(x=lon,y=lat,z=mean_WT_value/100),
stroke = 0.15,binwidth = 2) +
annotate("text", x = 0.5, y = 40.8, colour = "magenta", label = "x")+
guides(fill = guide_colourbar(barwidth = 30, barheight = 0.5))+
facet_wrap(~WT, ncol = 4) +
scale_fill_stepsn(colours = rev(pals::brewer.rdylbu(100)),name = "slp (hPa)",
limits = c(996,1032), breaks = seq(976,1032,2)) +
scale_x_continuous(limits = c(-20,30), expand = c(0, 0))+
scale_y_continuous(limits = c(25,70), expand = c(0,0))+
theme_void() +
coord_map(projection = "lambert",lat0 =0, lat1 = 70)+
theme(
panel.grid.major = element_blank(),
panel.grid.minor = element_blank(),
panel.background = element_blank(),
text = element_text(size = 10),
strip.background = element_rect(fill = "transparent", color = NA),
axis.title = element_blank(),
axis.text = element_blank(),
axis.ticks = element_blank(),
legend.position = "bottom")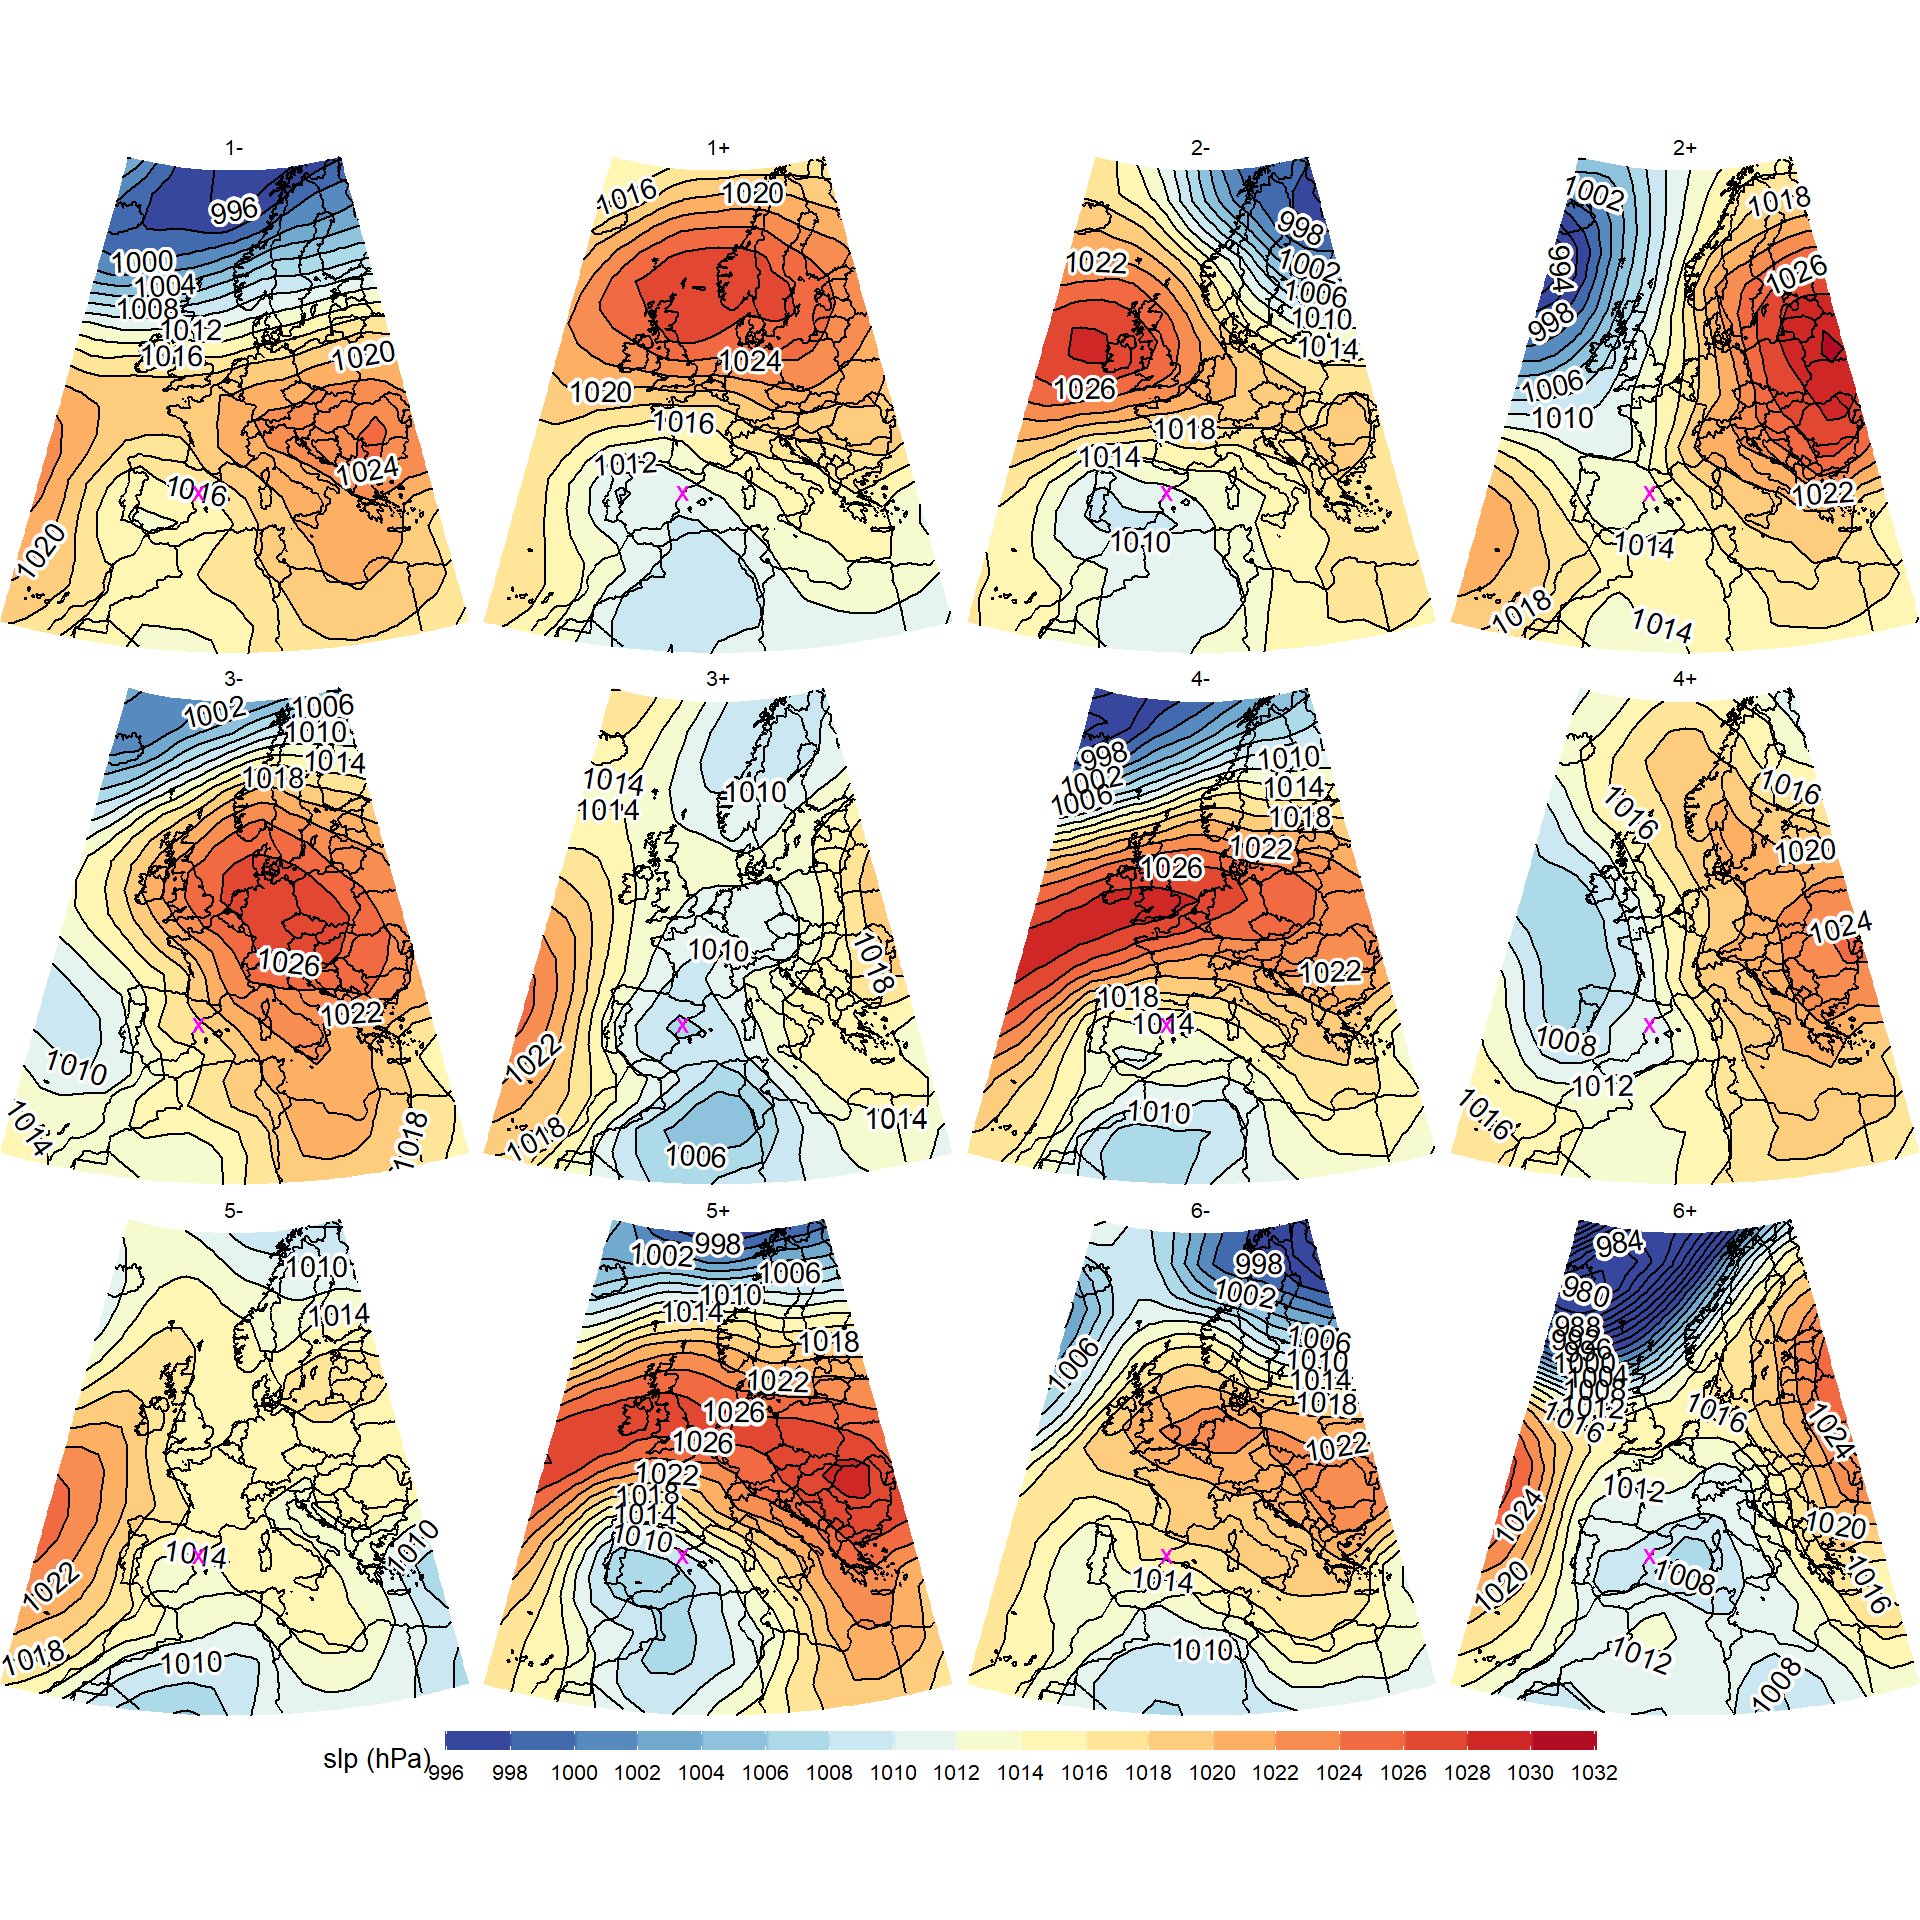
clas <- cl$clas_pn

# monthly frequence histogram
WTs <- sort(unique(clas$WT))
mo_hist <- clas %>%
  mutate(mo = month(time)) %>%
  group_by(WT,mo) %>%
  mutate(n = length(time)) %>%
  ungroup() %>%
  group_by(WT) %>%
  mutate(n_prop = n/length(time)) %>%
  distinct(WT,mo,.keep_all = T) %>%
  ungroup() %>%
  complete(mo, WT = WTs,
           fill = list(n_prop = 0))
ggplot(data = mo_hist, aes(x = mo, y = WT,fill = n_prop))+
geom_tile(color = "black") +
scale_fill_gradientn(colors = pals::brewer.blues(100),
name = "fi",
breaks = seq(0,1, by = 0.1)) +
geom_text(aes(label=round(n_prop,2)), size = 4)+
scale_x_continuous(name="Month",
breaks = seq(1,12,1),
expand=c(0,0)) +
guides(fill = guide_colourbar(barwidth = 15, barheight = 0.5))+
theme_classic()+
labs(title = "Frecuencia relativa mensual por tipo de circulación (WT)")+
theme(axis.text=element_text(size=8),
axis.title.x = element_text(size = 8),
axis.title.y = element_text(size = 8),
legend.title=element_text(size=8),
legend.text=element_text(size= 8),
legend.position="bottom")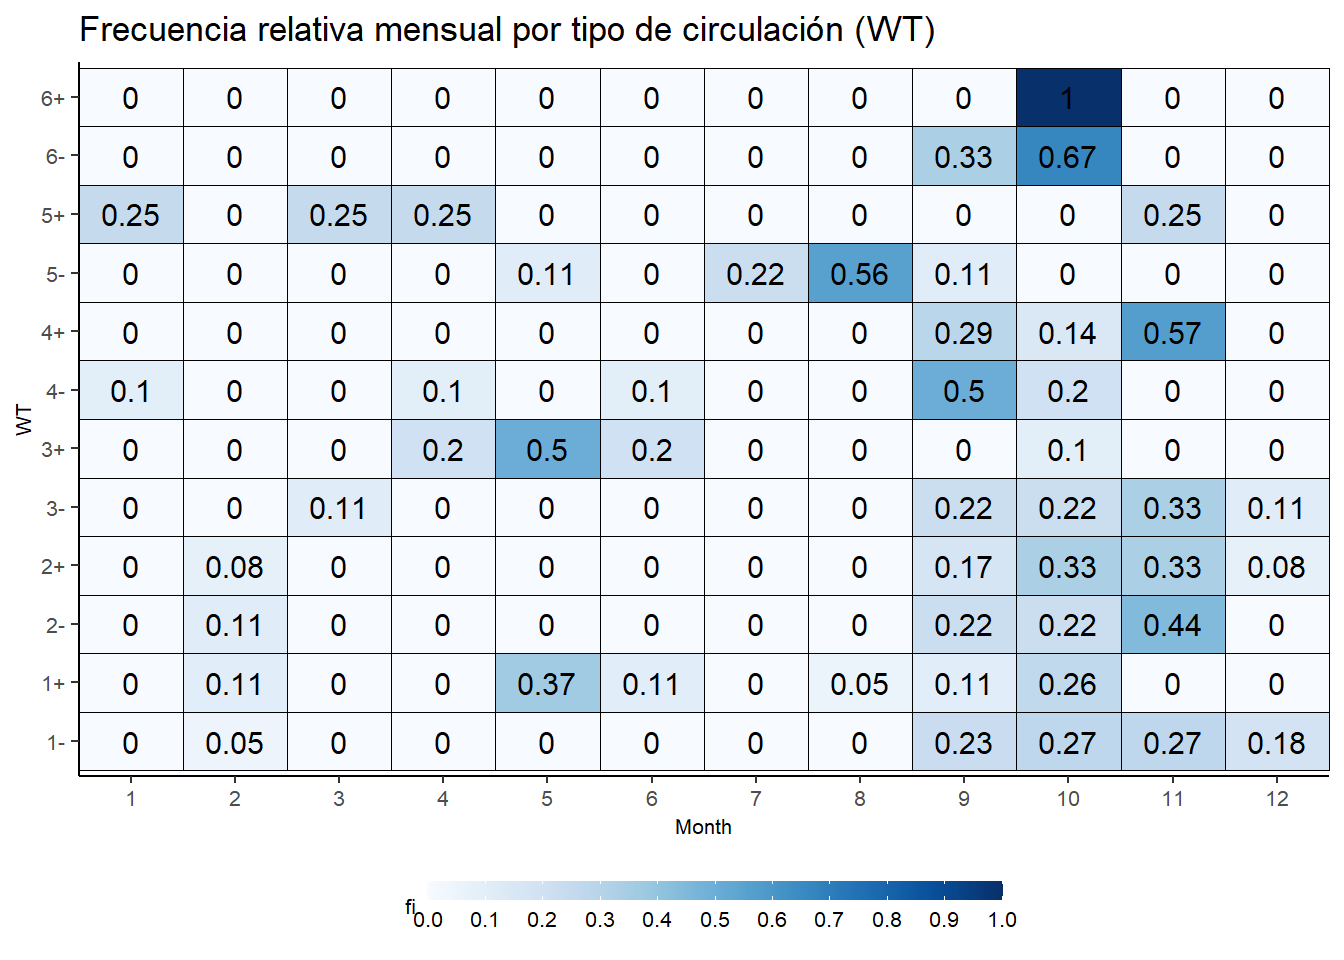
Extracting annual frequency trends
How to extract the trend of annual frequences per WT?
WT_time_series <- clas %>%
  mutate(yr = year(time)) %>%
  group_by(yr,WT) %>%
  mutate(n = length(time)) %>%
  ungroup() %>%
  distinct(WT,yr,.keep_all = T) %>%
  select(-time) %>%
  complete(yr, WT =WTs,
           fill = list(n = 0)) %>%
  complete(WT, yr =1948:2022,
           fill = list(n = 0))
ggplot(data = WT_time_series, aes(x = yr, y = 1, fill = n))+
geom_tile(color = "black")+
scale_x_continuous(labels = seq(1950,2020,5),
breaks = seq(1950,2020,5),
minor_breaks = seq(1950,2020,1)) +
scale_fill_gradientn(colors = pals::brewer.reds(100),
name = "Fi",
breaks = seq(0,5, by = 1)) +
labs(title = "Frecuencia absoluta anual por tipo de circulación")+
guides(fill = guide_colourbar(barwidth = 15, barheight = 0.5))+
facet_wrap(~ WT, ncol = 2,scales = "free_y") +
theme_void() +
theme(axis.text.x = element_text(colour="grey20",
size=8,
angle=90,
hjust=.5,
vjust=.5),
axis.text.y = element_blank(),
text = element_text(size=10),panel.grid = element_blank(),
legend.position = "bottom") +
ylab("Daily Frequency")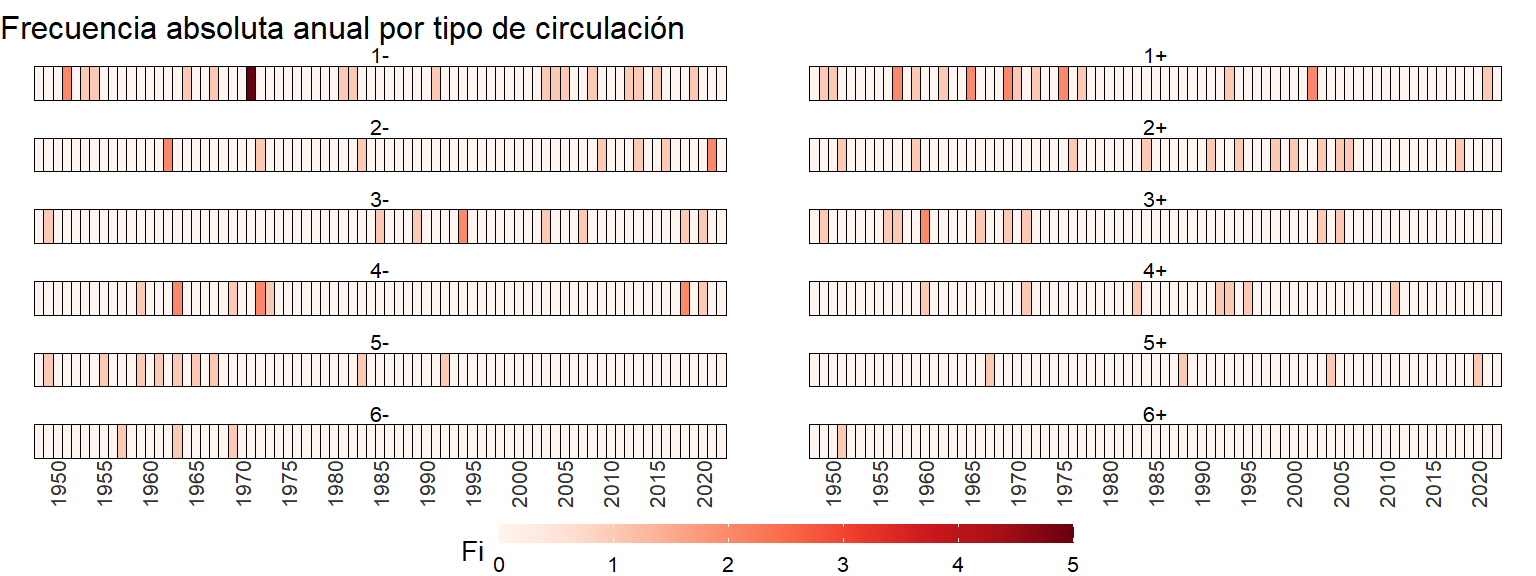
Marc Lemus-Canovas
Investigador Postdoctoral
Soy un apasionado del tratamiento de datos climáticos, especialmente utilizando R!